msxnet > Technical Info > Emulating the SCC
Current SCC emulaters aren't perfect. I've spent a long time sampling the output of the SCC and displaying a signal on an oscilloscope.
I've sacrificed one SCC cartridge for this, Salamander. I've removed the ROM IC and cut the sound out to the MSX, connecting wires directly to the output of the SCC (after the resistor-array).
For low frequencies I sampled the output on the PC. Using a program that calculates the frequency, I found that the formula is:
freq = fclock / (32 * (P + 1))
I assume fclock is 3579545Hz. P is the value programmed into the SCC.
For high frequencies, I used the oscilloscope. The formula was correct; however, whatever wave I programmed, with values 8 and lower of P, the SCC produced no signal at all.
A reasonably well-known fact is that if you sample the output of the SCC, when it's playing at a low frequency, the output seems to "drop" between the 32 wave-points. So instead of having 32 horizontal lines, they drop to the centre. While this is true when sampling on the PC, this was not at all visible on the oscilloscope.
However displaying the signal that comes out of the MSX (so not straight out of the SCC) is was visible. So I assume it is result of a capicitor on the MSX.
I don't know how important this capicitor is for SCC emulation. Further testing is needed for this, but for now I'm focusing on the direct output of the SCC.
Using the oscilloscope, I looked at the form of the output. I couldn't find any difference between what I put into the SCC and what came out, at the lowest (P = 9) or highest (P = 0xfff) the output was always exactly like what I programmed, except for the following:
Here is were it gets interesting. In King's Valley II, when your throw the knife it doesn't sound right in MESS. The part that doesn't sound right is the following wave:
00 00 00 00  00 00 00 00
7F 80 7F 80  7F 80 7F 80
7F 80 7F 80  7F 80 7F 80
00 00 00 00  00 00 00 00
This is played at at high frequency (P = 0x23, P = 0x14). When I tested this on the SCC, and displayed it on the oscilloscope, the form was correct but the volume a lot lower than I expected!
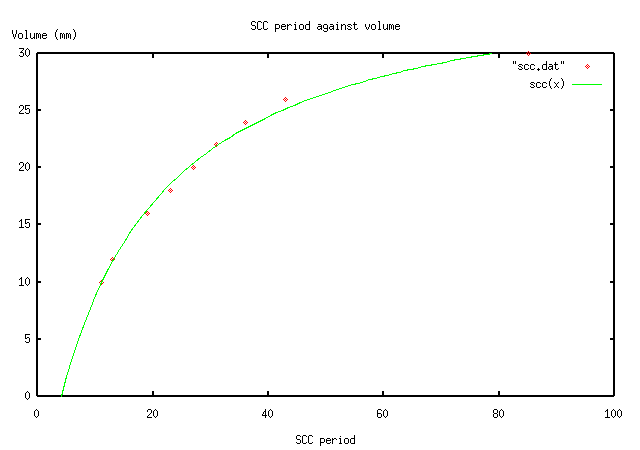
The frequency (P) is related to the volume. I programmed a wave which was 0x80 and 0x7F alternating, and measured the volume. The units on the oscilloscope are 0 - 30mm. With a low frequency, volume 15 is 30mm, volume 10 is 30mm and volume 5 10mm.
The results:
P	volme (mm)
------------------
85      30      (uncertain!)
43      26
36      24
21      22
27      20
23      18
19      16
13      12
11      10
Note that P = 85 is quite uncertain, since it's hard to see where the volume is the maximum. Possibly it's higher.
Now I used gnuplot to create a graph, and find a function for the table. I assumed it would have the following form, with the values gnuplot found.
	scc(amp) = a / (amp + b) + c

        a = -740.306407461523
        b = 15.4269064068793
        c = 37.850779078801
Here's the graph:
Test wave data:
00 11 22 33 44 55 66 77 88 99 AA BB CC DD EE FF
00 11 22 33 44 55 66 77 88 99 AA BB CC DD EE FF
Reading (which sets all bits):
Write 11X00011:
11 or 12 times the same value before it goes to the next one in Wave RAM.
Write 11000001:
55 66 88 99 BB CC DD FF 00 22 33 55 66 etc.
Write 11000010:
12 times the same value before it goes to the next one in Wave RAM.
Write 11100000:
16 times the same value before it goes to the next one in Wave RAM.
Write 11000000:
32 times the same value before it goes to the next one in Wave RAM.
Write 11000010:
Tone = FFF: 11 or 12 times the same value before it goes to the next one in Wave RAM.
Tone = 000: 11 88 FF 66 DD 44 BB 22 99 00 77 EE 55 CC 33 AA
BiFi <bifi@msxnet.org>.